Which adapters report exposures?
Over 140 of them, as of March 2025: beyond scoping assets, Axonius adapters gather the security context your existing IT and security solutions discover.

Read the full section
Axonius supports discovery by providing a single source of truth for exposures. The source of truth contains exposures reported by all your security tools alongside exposures identified by Axonius. Axonius achieves discovery through exposure and vulnerability adapters, discovery logic, static analysis and enrichments, exposures, misconfigurations (through queries and dashboards), and external to internal mapping.
These adapters (from the Axonius adapters documentation, search for “vulnerabilities” or “exposures”) provide information about vulnerabilities, cloud security, and application development exposures. They range from traditional vulnerability scanners, to endpoint protection platforms, to threat intelligence feeds, to breach and attack simulation (BAS), to SAST and DAST scanners, CNAPP platforms, and much more.
Axonius then applies the same discovery logic from scoping assets to aggregate, correlate, and deduplicate your exposures. That gives your teams an accurate list of exposures that are uniquely identified, enriched, and free from inconsistencies.
What do vulnerability enrichments add?
Context from the major vulnerability sources, for every asset and exposure, including assets no scanner covers.

Pick a case to see what adapters and enrichments each contribute:
| 1. Vulnerabilities found by your systems | 2. Vulnerabilities not yet found by your systems | 3. Vulnerabilities where scanners are not present | |
|---|---|---|---|
| 140+ Adapters | Aggregated scanned data | Scan failures; waiting for re-scan | No scanner present |
| Enrichments | Complementary context | Initial context | Vulnerability Context |
| Outcomes | Better vulnerability intelligence | Reduce time to recognition; reduce pressure on scan SLAs; mitigate scan failures | Discover exposures in assets without scanners |
Read the full section
As part of the discovery logic, Axonius enriches all your assets (from the scoping step) and exposures (in the discovery step) with data from major vulnerability context providers such as NIST National Vulnerability Database (NVD), CISA Known Exploited Vulnerabilities (KEV), Exploit Prediction Scoring System (EPSS), and the Microsoft Security Response Center (MSRC) along with any of your desired threat intel feeds.
This information is used in three ways: to enrich vulnerabilities already found by your security solutions, to identify emerging vulnerabilities faster than the scanner cadence, and to identify vulnerabilities in assets without a scanner or a recent scan.
What is an exposure in Axonius?
An exposure item combines the security context (i.e. vulnerability CVE, technical score, threat intelligence feed data) with asset context and business context.


Read the full section
Axonius aggregates exposures — from all your assets across on-prem and cloud infrastructure — under the exposures category. This information is used in subsequent CTEM steps to help prioritize and mobilize the right teams.
How does Axonius find misconfigurations?
Out of the box, the Axonius discovery logic includes steps — aggregation, deduplication, normalization, and correlation — that can uncover gaps in security controls and misconfigurations such as:
-
Missing security controls
By identifying a laptop reported by all your systems — CMDB, endpoint management, meeting client, and VPN client — but missed by your endpoint protection (EPP), you identify a gap in EPP coverage.
-
Gap in identity security posture
By identifying users in an important department (reported by your HR), with admin rights, accessing a system without MFA (reported by your SaaS Apps), you identify a gap in identity coverage.
-
Shadow SaaS Apps
By identifying a SaaS app purchased by your organization (reported by your expense system) or from your DNS monitoring, without SSO, MFA, or Identity Governance (reported by your Identity Provider), you identify SaaS applications missing critical security controls.

Read the full section
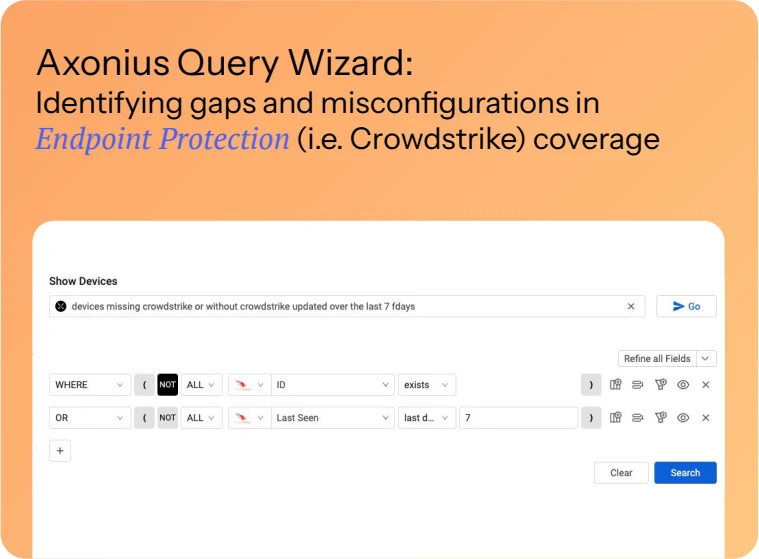
Queries identify assets with exposures including missing security controls (i.e. device missing CrowdStrike) and misconfigurations (CrowdStrike sensor installed but inactive). Queries can be presented in dashboards for tracking and used in subsequent CTEM steps: prioritization, validation, and mobilization.
Dashboard Templates — such as the SaaS Overview, Data Hygiene, and Security Posture dashboards — provide out of the box discoveries from Axonius in a dashboard format alongside baseline queries. The templates can be created from the Axonius Dashboard and tweaked to fit your needs.
What is external to internal mapping?
It finds what attackers can reach from outside by reading your own network configuration: Axonius reviews your DNS, load balancers, firewalls, and subnets to identify assets and exposures publicly exposed to external attackers.

-
High-fidelity signals
By leveraging your real attack surface as the baseline.
-
Risk opaque to external scanners
Such as horizontal scale (adding new servers to increase production performance).
-
Earlier identification
Risk identification before incoming traffic is introduced.
Read the full section
The external to internal information is provided both in table format (mapping your configuration) and as a graph with additional asset context. Compared to external scanning through the internet, identification through the network configuration provides three benefits:
From pages 11 to 16 of the PDF. Download the PDF