Step 3 of 5: Prioritization

Calculate exposure risk by factoring in business impact, exploitability, adversary behavior, and risk scores beyond CVEs/CVSS.

The 5 steps as a cycle, with step 3, Prioritization, marked. Each step links to its page.

Goal

Focus mitigation

The challenge

How do you apply rigor and consistency amidst urgency?

What makes it hard
  • Issues and alerts lack business context and exploitability insights
  • Often unclear ownership of the asset, the mitigation, and the result
  • Internal and external SLAs often get in the way of risk-based prioritization

How Axonius helps

It scores risk from security, asset and business context together, not from CVSS alone.

What is the unified context?

It is the security context, asset context, and business context that Axonius collects and tracks during Scoping and Discovery, as reported by your systems.

Dark panel: "The Unified Context is the combination of Asset, Security and Business Context". Venn diagram of three circles. Security Context: Vulnerability Scanner, Endpoint Protection/AV, Threat Intelligence. Asset Context: Asset online, EPP coverage, Asset state, Internet traffic, Linked to admin, Domain controller. Business Context: Business owner, Risk owner, In PCI Network, Crown jewel, SLA & MTTR.
The unified context combines asset, security and business context.

Example: the same query with and without asset and business context. Vulnerabilities with score higher than 6 return 281 issues; the same vulnerabilities in AWS with a PROD tag return 6.

Screenshot titled "Vulnerabilities with score higher than 6 (281 issues)". Vulnerability Instances query: ("specific_data.data.axonius_risk_score" > 6), Total 281, Unique Device Count 146. Query Wizard condition: WHERE NOT ALL Axonius Risk Score > 6. Buttons Clear, Search. One hostname in the first visible rows is masked.
Vulnerabilities with score higher than 6: 281 issues.
Screenshot titled "Vulnerabilities with score higher than 6 in AWS with a PROD tag (6 issues)". Total 6, Unique Device Count 5. Query Wizard: WHERE NOT ALL Axonius Risk Score > 6; AND NOT RLT Devices Has exists; WHERE NOT ALL AWS Tags: AWS Tag Value equals PROD. Buttons Clear, Search.
The same query in AWS with a PROD tag: 6 issues.
  1. Security context Vulnerabilities with score higher than 6

    281 issues

  2. Security, asset and business context Vulnerabilities with score higher than 6 in AWS with a PROD tag

    6 issues

Unified context used in the platform: two queries from page 18. The bar is drawn to scale.
Read the full section

Axonius supports prioritization by calculating the risk of your assets and exposures from security, asset and business context, through its unified context, risk score engine, and dashboards.

Security context means vulnerability CVE, technical score and threat intelligence feed data; asset context means asset state, status, and gaps; business context means the risk or business owner of the asset, crown jewel, in production, part of the PCI network. This information is combined, correlated, and made available for every asset and exposure in the Axonius platform, making the unified context available for prioritization decisions across all components — including queries, risk engine, dashboards, workflows, and automations.

How does the risk score engine work?

The risk score engine quantifies the risk of assets and exposures based on the unified context.

Orange panel "Risk Score set up: Using security context (vulnerability scores and crowdstrike presence) alongside device context (hostname patterns, if the asset has public traffic from the internet), and business context (if asset is a crown jewel) to calculate risk." Screenshot of the Axonius Risk Score editor, "Axonius risk score v0.4 (backend)", with a Score Calculation table of weighted fields: Device ID 15, Publicly Exposed By 15, Host Name 20, Public IPs 15, CVSS Score 10, Percentile 10, a crown-jewel business application field 15, with a note that the weights total 100% (Remaining 0%). Left tree under Devices lists Axonius risk score v0.4 (backend), Calculate combined Risk Score, JF - Axonius risk score, Device risk score V0.1, Axonius risk score v0.3; also Vulnerabilities and Vulnerability Instances.
A risk score built from security, device and business context.
Read the full section

To calculate risk, organizations can either start from the Axonius-defined risk score or use their own logic based on their business characteristics.

The risk score helps organizations focus on exposures that require immediate attention and can also be used in subsequent steps to prioritize what exposures should go through validation and mobilization.

How do dashboards help prioritize?

Dashboards leverage unified context and risk scores to surface CTEM prioritization in different ways. They are also used in subsequent steps to track the validation and mobilization of prioritized exposures.

  1. Organizational risk

    The overall view helps organizations track their current risk, historical performance, and risk in the attack surface broken by assets.
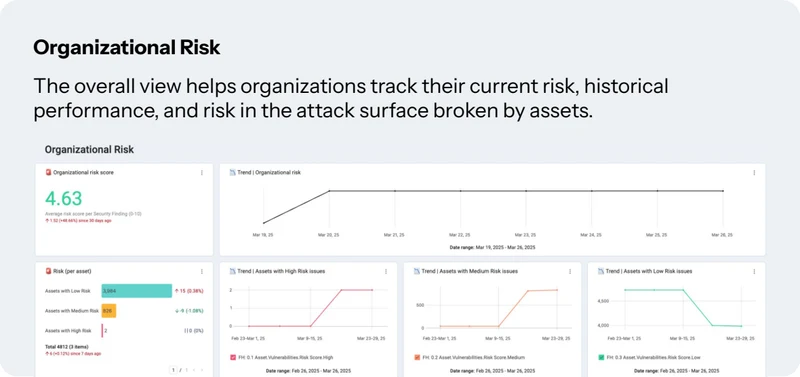
    Dashboard panel "Organizational Risk: The overall view helps organizations track their current risk, historical performance, and risk in the attack surface broken by assets." Shows an organizational risk score of 4.63, a trend line chart, a risk-per-asset bar list and three trend charts (assets with high, medium and low risk).
  2. Security findings

    Through the risk score, hundreds of thousands of security findings are segmented by risk, tracked historically, and associated with risk owners.
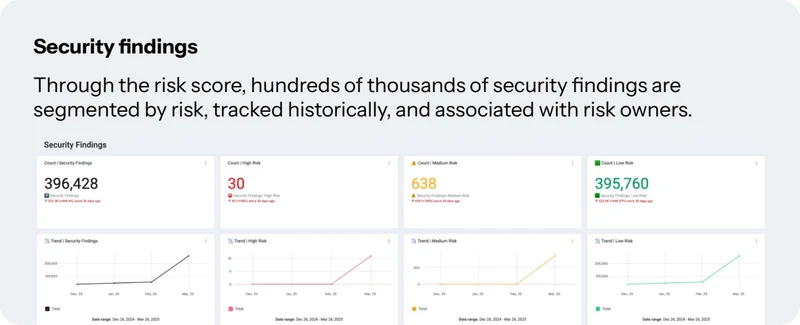
    Dashboard panel "Security findings: Through the risk score, hundreds of thousands of security findings are segmented by risk, tracked historically, and associated with risk owners." Four tiles: 396,428 security findings, 30 high risk, 638 medium risk, 395,760 low risk, each with a trend line.
  3. Explainability

    The risk score and security findings can be surfaced and combined with asset views to drive discussions and prioritizations with key stakeholders.
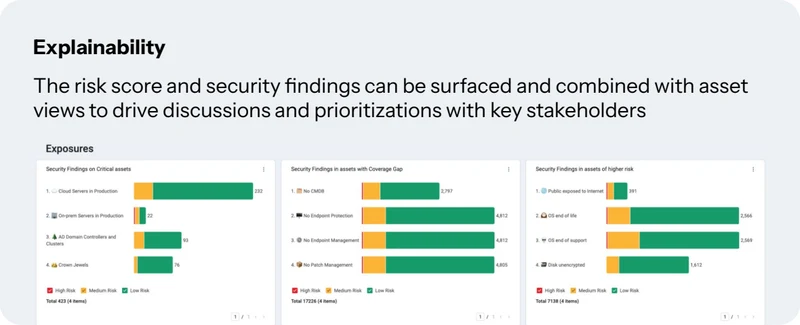
    Dashboard panel "Explainability: The risk score and security findings can be surfaced and combined with asset views to drive discussions and prioritizations with key stakeholders." Three stacked-bar charts, "Exposures", of findings by risk level (green low, orange medium, red high) across asset categories.

From pages 17 to 20 of the PDF. Download the PDF